My digital work / 06
Data Analysis & Visualization
Marketing analytics and data science: GA4 and Looker Studio dashboards, automated reporting, and Python models.
From ad click to website behaviour, in one view.
For a local perfume brand, I connected Meta Ads data, Google Analytics 4 and Looker Studio to answer one question: which ads bring people who actually engage and buy? These are the dashboards and the findings from one month of data.
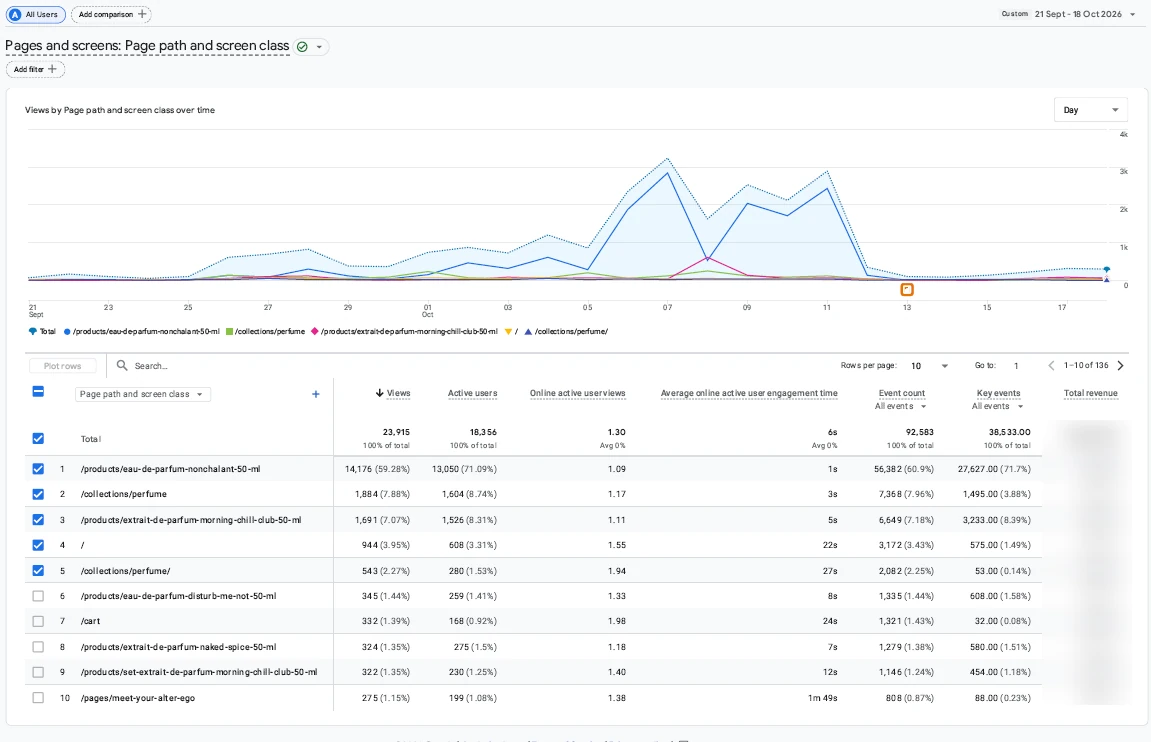
One product page took 59% of all views
The Nonchalant product page drew 14.2k of 23.9k views, peaking from 5 to 11 October while the Nonchalant sales ads were running. Paid social brought 6k sessions, the second-largest source after direct.
Clicks arrive, but they don't stay
Average engagement on the Nonchalant product page was about 1 second, compared with 22 seconds on the homepage and 1m 49s on the Meet Your Alter Ego page. The next test: send part of the traffic to richer pages and compare checkouts.
Ads are building brand search
Brand queries such as “page by page” make up most of the 259 organic clicks, at an average position of 3.5. Product names like “morning chill club” are now searched and rank in the top three.
- 01
Collect
Apps Script pulls Meta Ads data daily; GA4 tracks what happens on the site.
- 02
Model
Google Sheets tabs per dataset: daily ads, demographics, funnels.
- 03
Visualise
Looker Studio dashboards per objective, filterable by ad set and date.
- 04
Act
Weekly insights that decide budget, creatives and landing pages.
Tools I use, from tracking to modelling
Analytics & tracking
Dashboards
Automation
Data science
Data science projects
Machine learning, NLP and dashboards, with code and write-ups
Indonesia's Election Sentiment Analysis
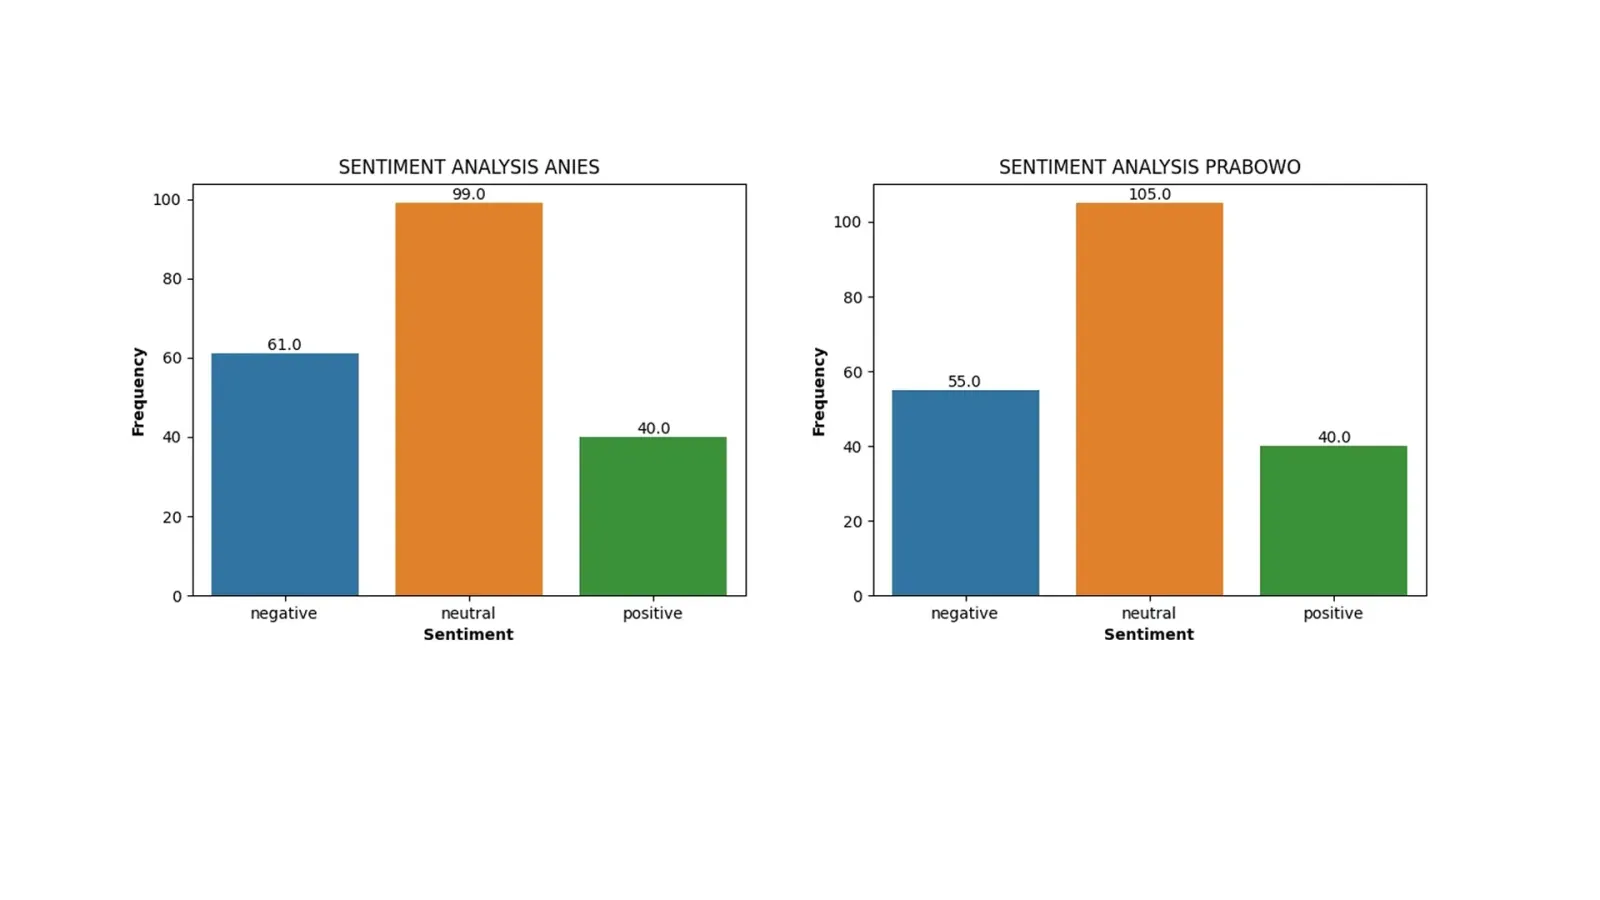
A natural language processing project analyzing public sentiment around Indonesia's election across social media. Built with TensorFlow and trained on Indonesian-language data to classify opinions as positive, negative, or neutral.